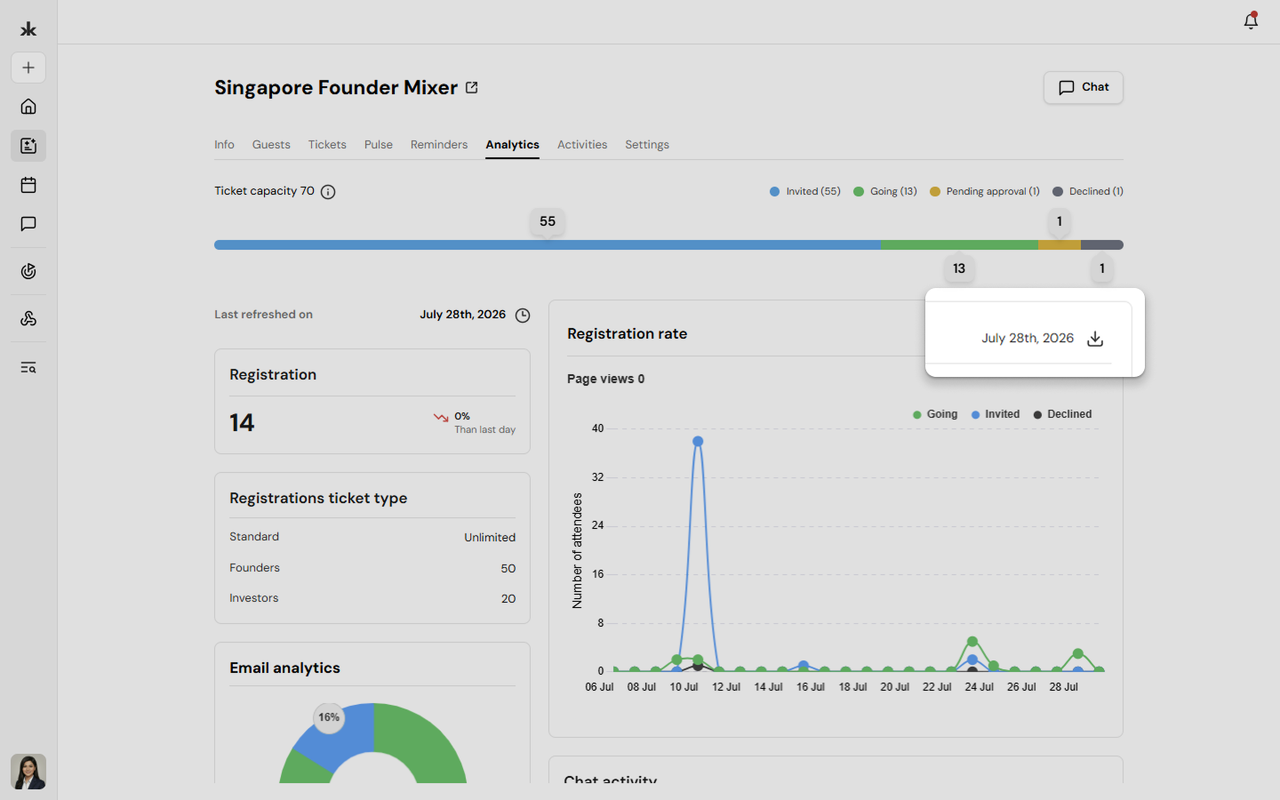
The Analytics tab provides insights into your event's performance, attendee engagement, email performance, and participation trends. These metrics help organizers measure the success of an event and understand attendee behavior.
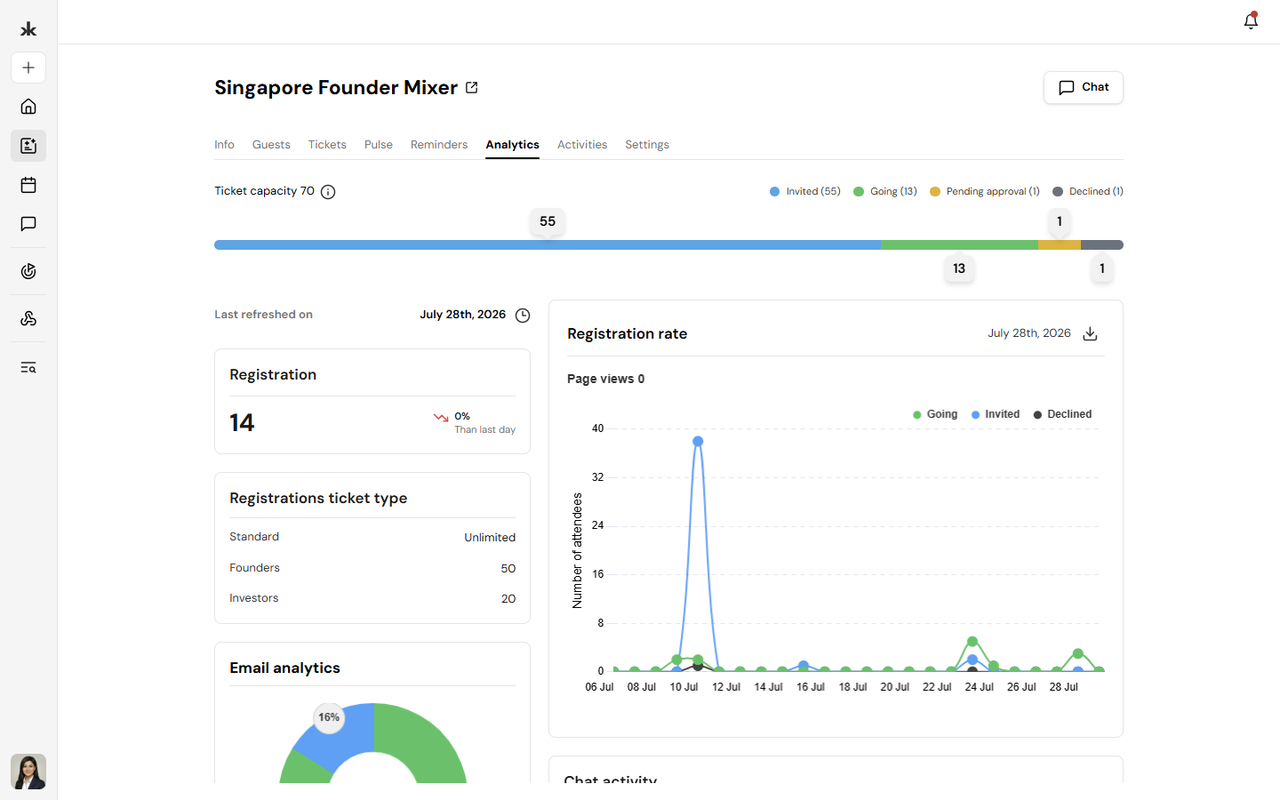
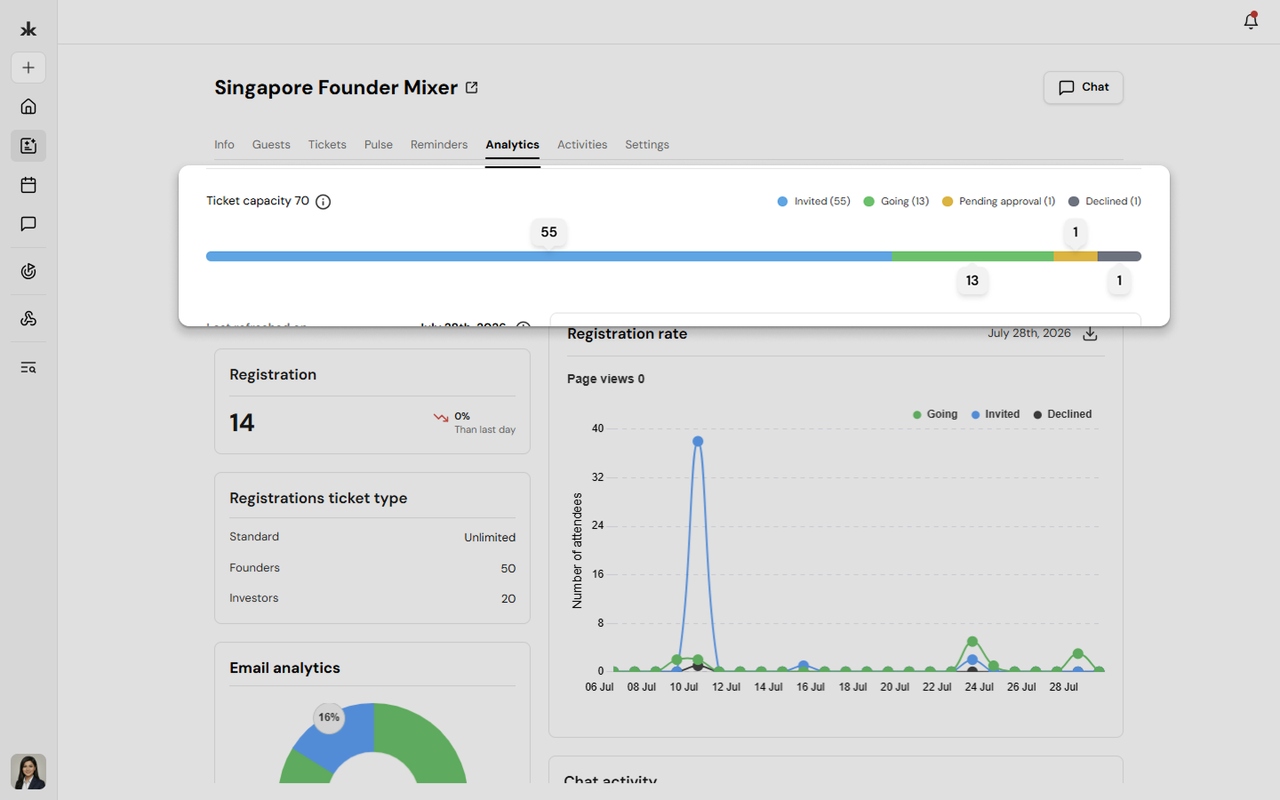
The Registration Summary provides a quick overview of your event registrations.
It includes:
- Total registrations for the event
- Registration trend
- Last refreshed date and time
This section helps organizers monitor registration growth at a glance.
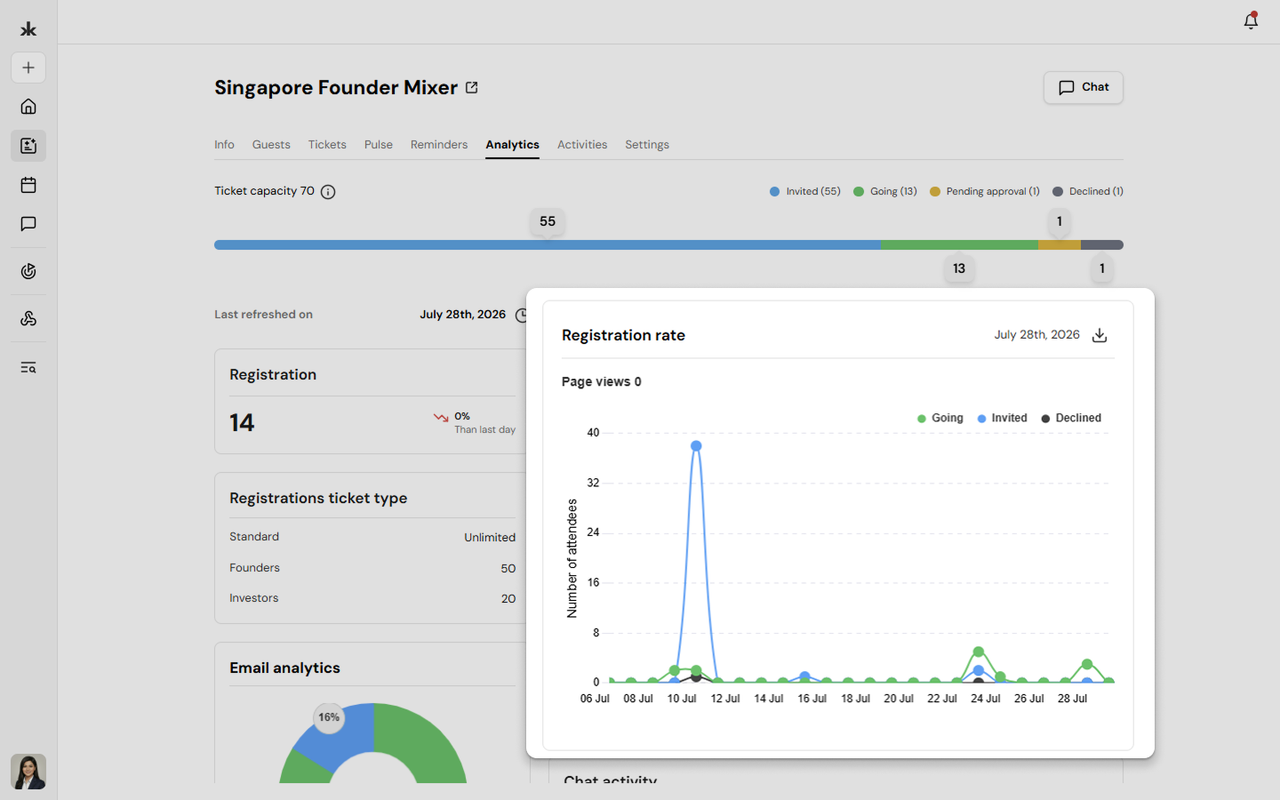
Registration Trends
The Registration Trends chart visualizes attendee responses over time, making it easy to identify registration patterns.
The chart displays attendee statuses such as:
- Going
- Invited
- Declined
This helps organizers understand how registrations are progressing throughout the event lifecycle.
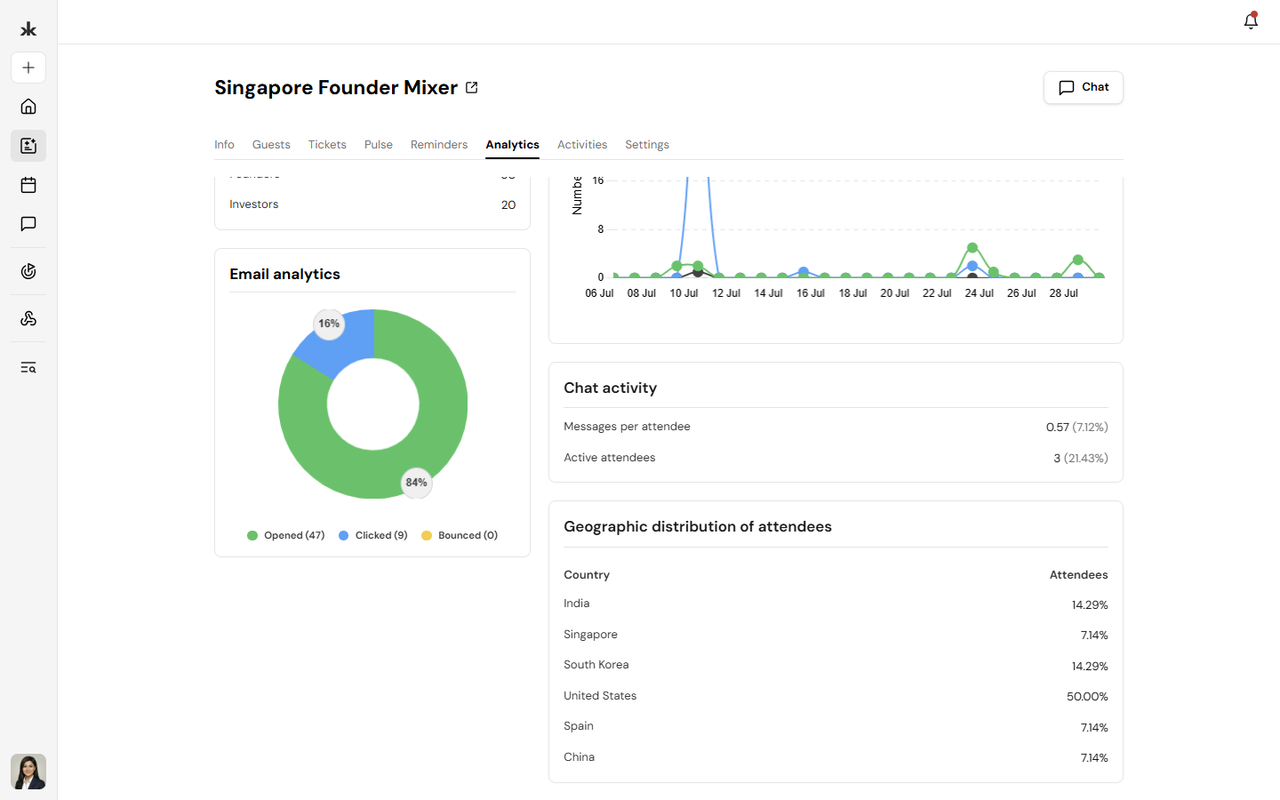
Email Analytics measures the performance of event emails sent to attendees.
Available metrics include:
- Opened - Number of recipients who opened the email
- Clicked - Number of recipients who clicked links within the email
- Bounced - Number of emails that could not be delivered
These metrics help evaluate the effectiveness of event communication.
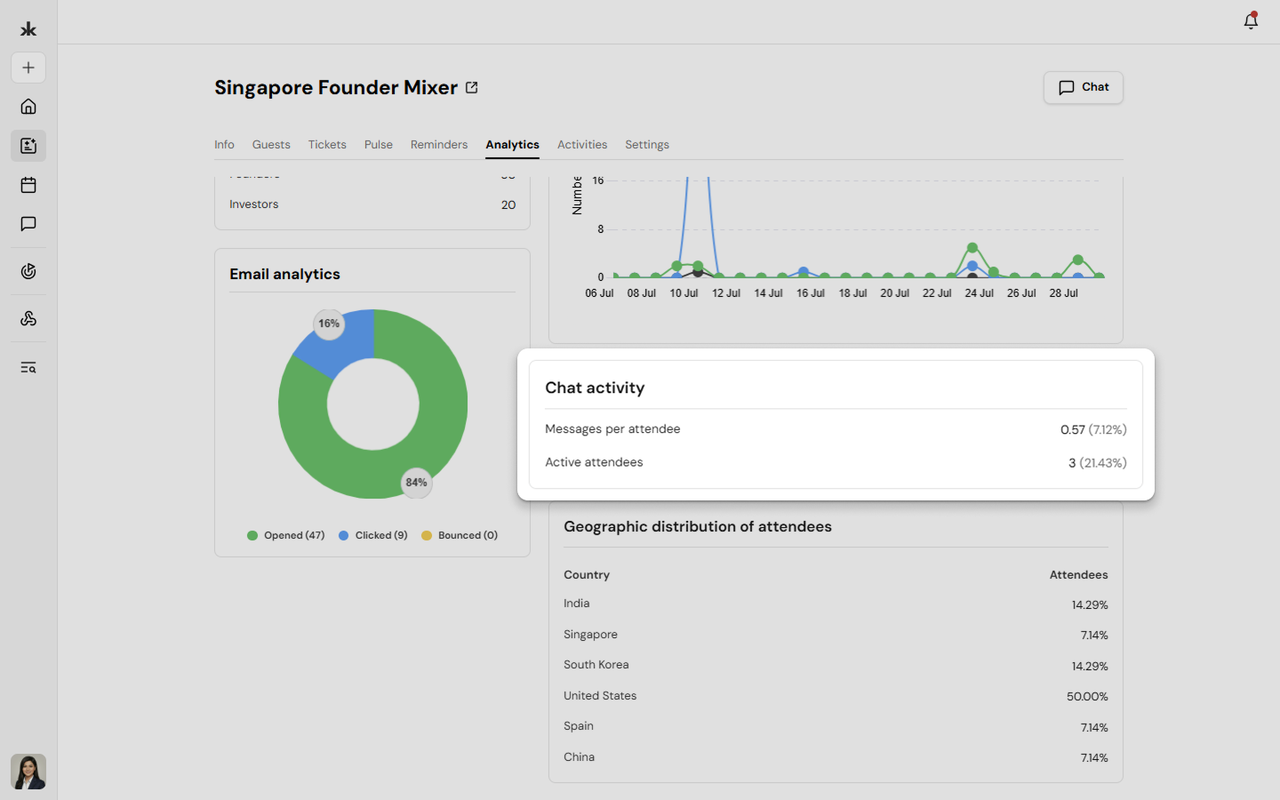
The Chat Activity section provides engagement metrics for event conversations.
Available metrics include:
- Messages per attendee - Average number of chat messages sent by each attendee
- Active attendees - Number and percentage of attendees who participated in chat
These insights help organizers understand attendee interaction during the event.
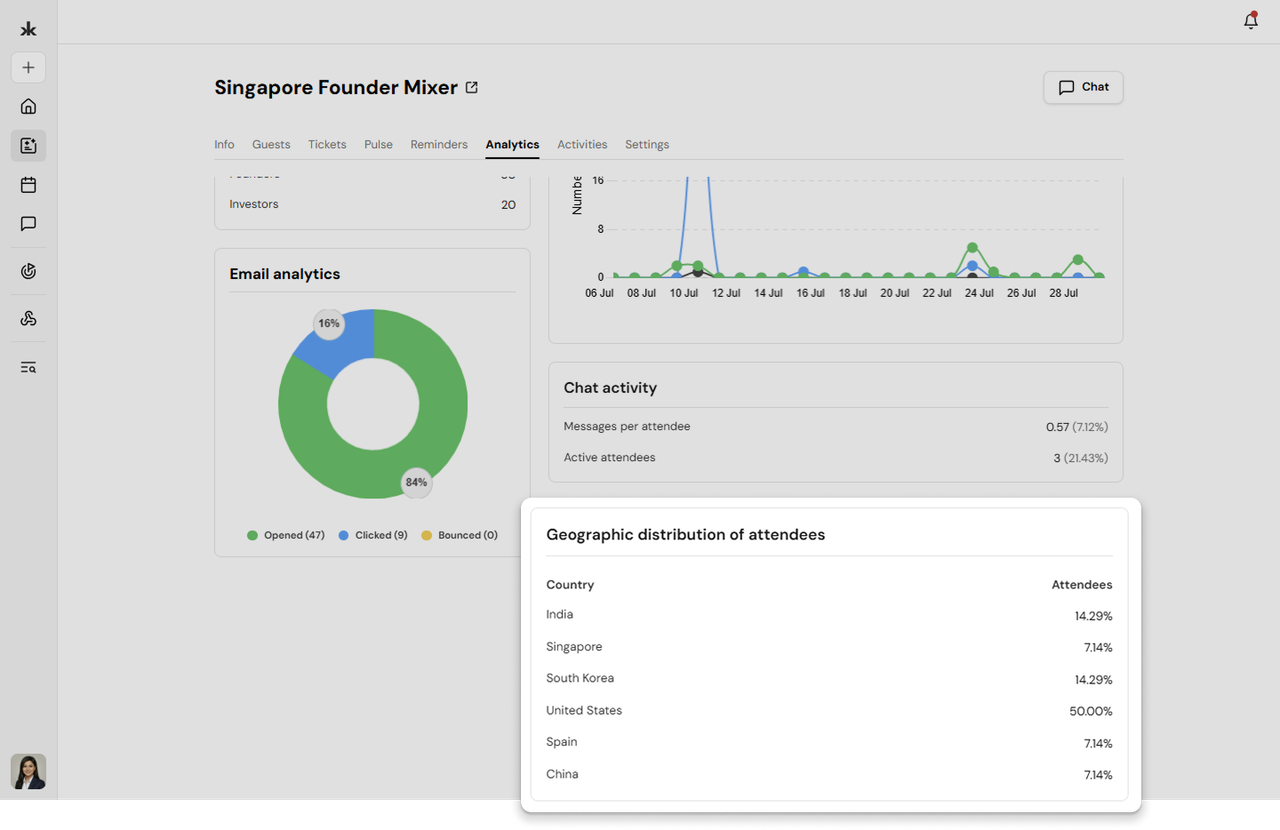
Geographic Distribution of Attendees
This section displays where your attendees are located based on their registered country.
It provides:
- Country names
- Percentage of attendees from each country
This information helps organizers understand the geographic reach of their event.
Export Analytics
Registration rate has an Export option, allowing organizers to download available analytics data for reporting or further analysis. Export availability may vary depending on the type of analytics being viewed.